####Concept
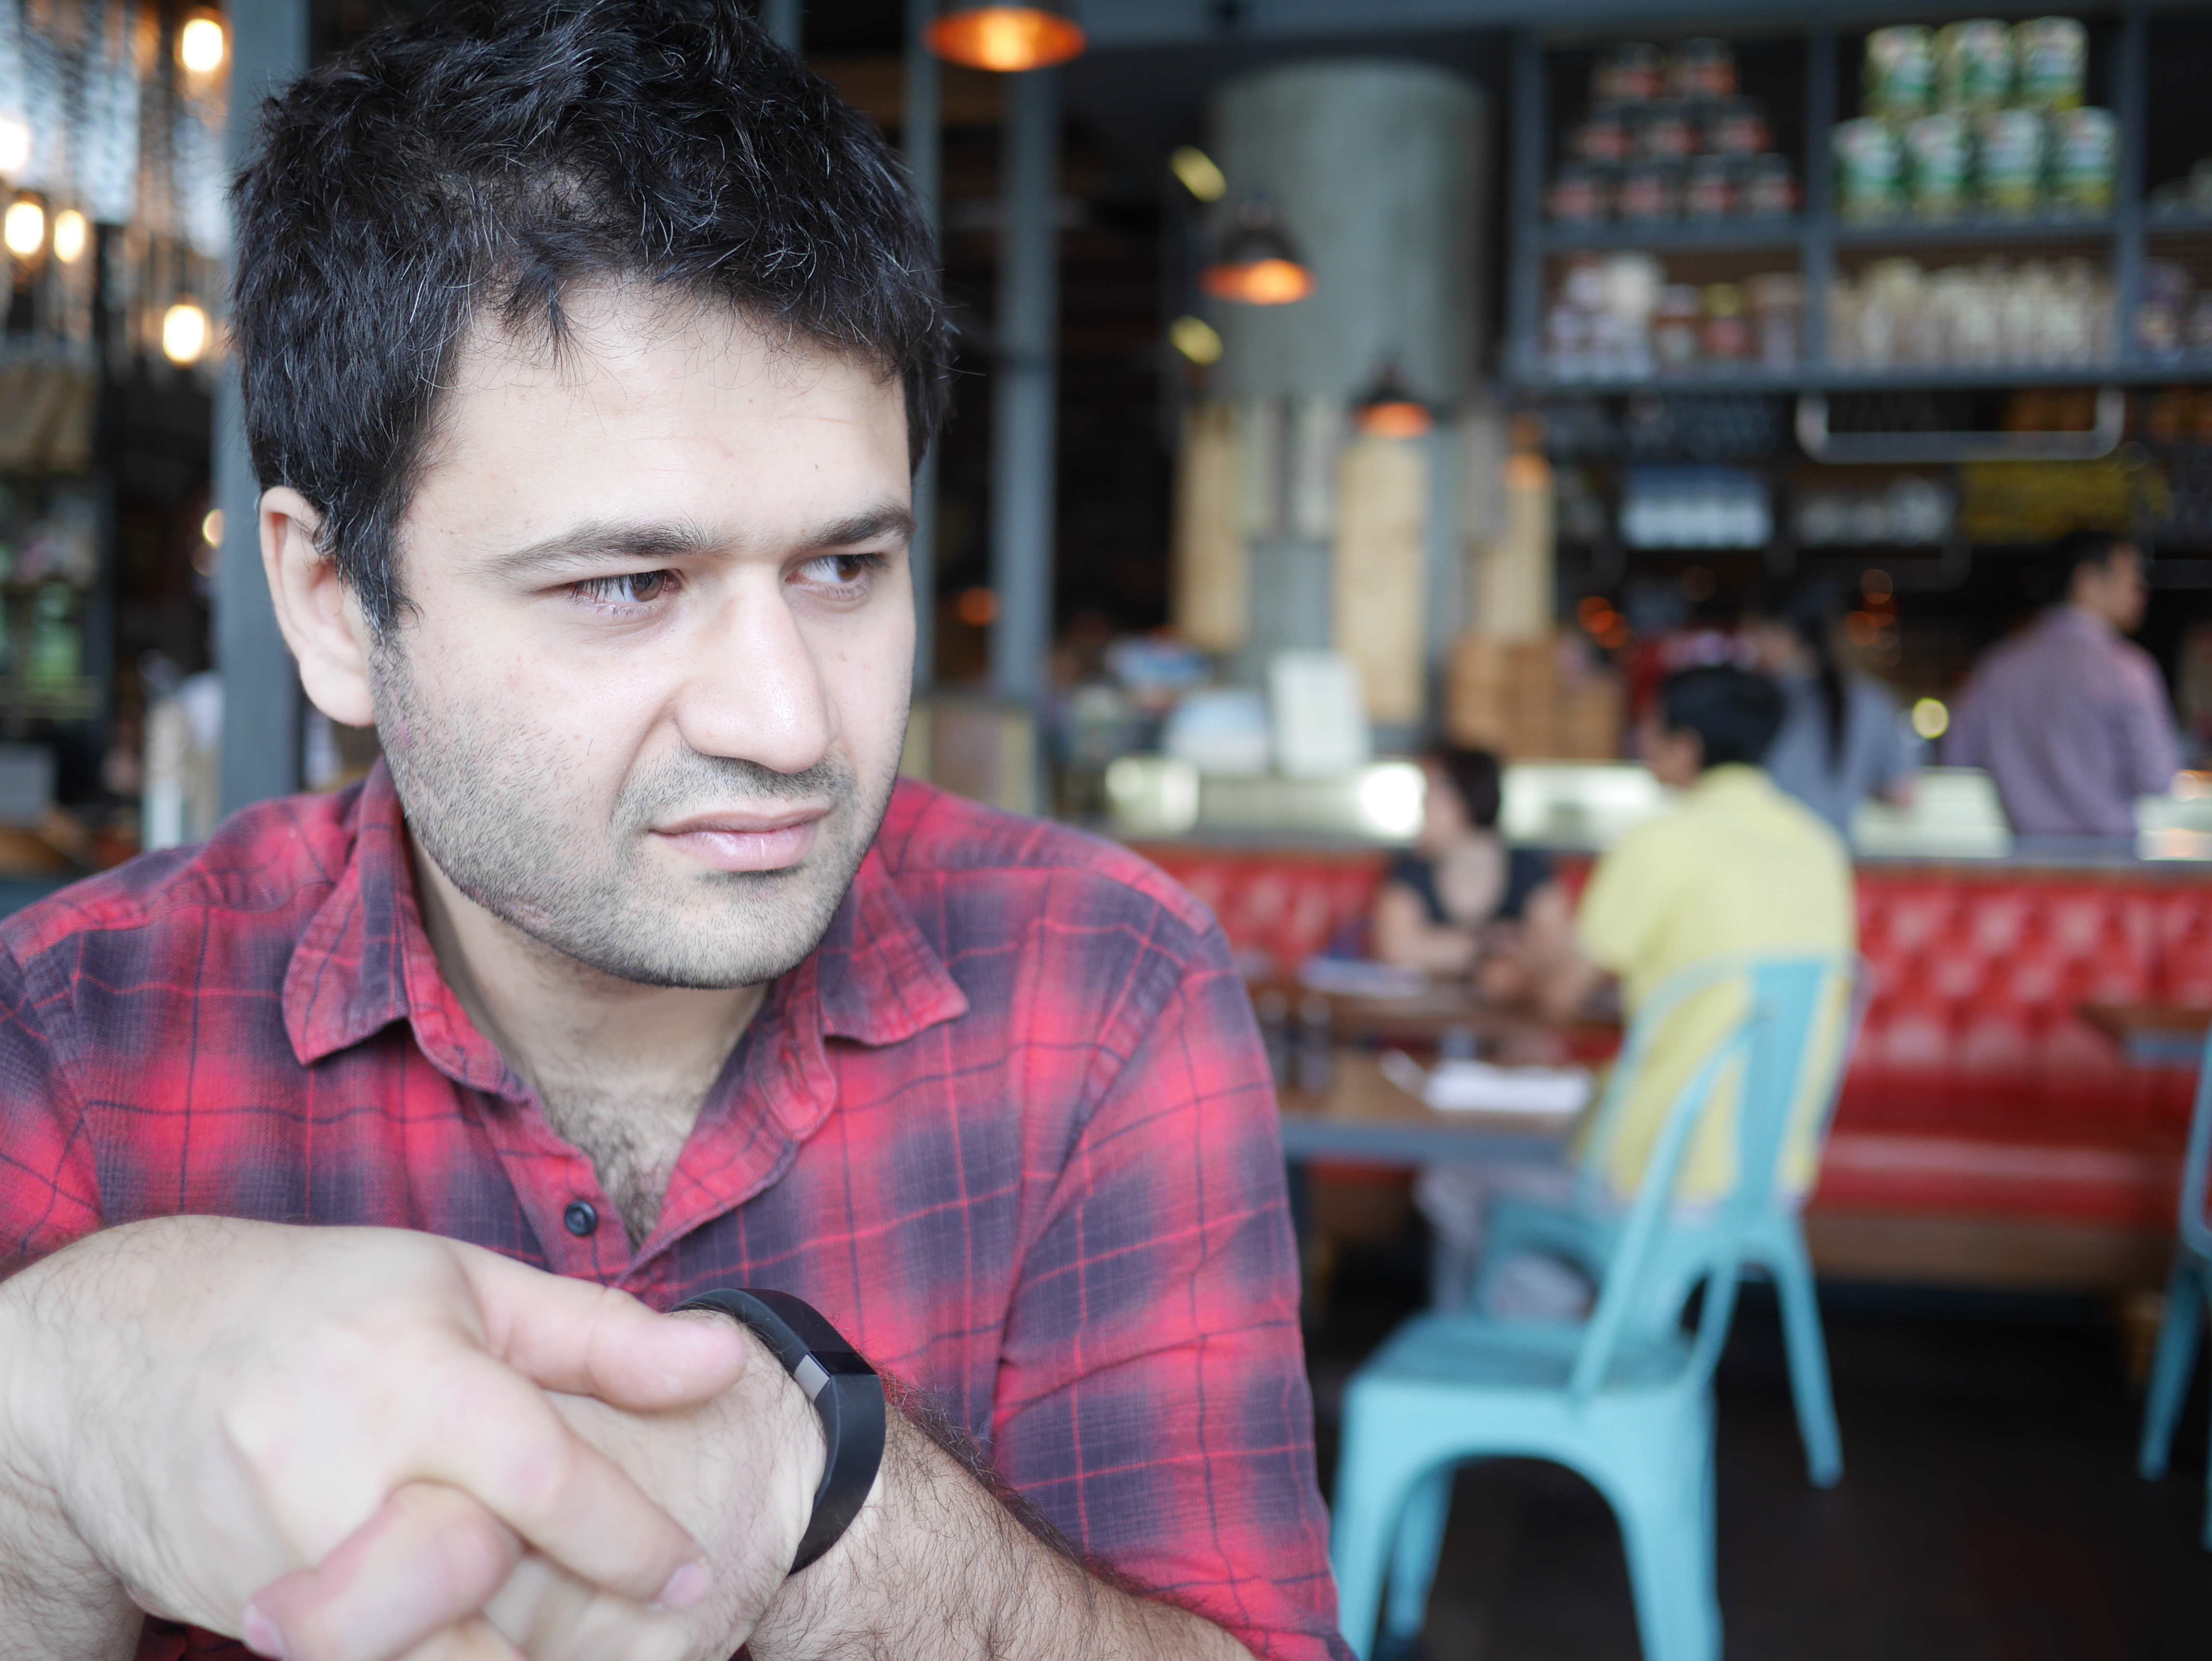
Osama & Dan O’Sullivan watch over weather changes in cities Osama’s lived in. Literally.
####Process
For this assignment I work in p5 with help of data visualization techniques taught by Moon in his workshop.
First, I create a Canvas and load an image of the globe as the background.
function preload() {
  globe = loadImage('images/globe_natural.jpg');
}

function draw() {

  background(globe);
Next, we loadJSON via openweathermap API in setup() and declare global variables/arrays to include city names.
var cityNames = ["NewYork", "London", "Lahore", "Karachi", "Singapore"];
var cityWeathers = [];

function setup() {

  for (var i = 0; i < cityNames.length; i++) {
    var url = 'http://api.openweathermap.org/data/2.5/weather?q=' + cityNames[i] + '&units=metric&APPID=3d426fed351a3f89e407b449aade58db';
    //  loadJSON(url, FUNCTION);
    loadJSON(url, getWeatherData);
  }
Declare a function cityWeatherData() where we define objects that are relevant to us:
function cityWeatherData(data) {
  this.lon = data.coord.lon;
  this.lat = data.coord.lat;
  this.weather = data.weather[0].main;
  //this is because data.weather.main in in an array in the json file
  this.temp = data.main.temp;
  this.humidity = data.main.humidity;
  this.tempMin = data.main.temp_min;
  this.tempMax = data.main.temp_max;
  this.windSpd = data.wind.speed;
  this.windDeg = data.wind.deg;
  this.cityName = data.name;
}
Then, we create a callback for pushing data into array cityWeathers[].
function getWeatherData(data) {
  print(data);
  cityWeathers.push(new cityWeatherData(data));
Now we draw() data coming in from the array. We map data to fit it into canvas. I’m having trouble getting the data to map such that it aligns with the globe image in background(globe). This is what draw looks like:
background(globe);

function preload() {
  globe = loadImage('images/globe_natural.jpg');
}

for (var i = 0; i < cityWeathers.length; i++) {

var posX = map(cityWeathers[i].lat, 90, -90, 0, width);
      var posY = map(cityWeathers[i].lon, -180, 180, 0, height);
      var h = map(cityWeathers[i].temp, -10, 40, 150, 0);

      push(); //return to rgb mode at pop
      colorMode(HSB);
      fill(h, 100, 100);
      noStroke();
      ellipse(posX, posY, 10, 10);
      pop(); //return to rgb mode at pop

      // wind line
      push();
      stroke(255);
      strokeWeight(2);
      angleMode(DEGREES);
      translate(posX, posY);
      rotate(cityWeathers[i].windDeg - 90);
      line(0, 0, cityWeathers[i].windSpd * 10, 0);
      pop();

      textSize(9);
      // text(cityWeathers[i].temp, posX + 20, posY);
      text(cityWeathers[i].cityName, posX + 20, posY + 20);
      text(cityWeathers[i].weather, posX + 20, posY + 40);
      text(cityWeathers[i].tempMin + " C min |" + " " + cityWeathers[i].tempMax + " C Max", posX + 20, posY + 60);
      noLoop();
    }
  }
Finally, ofcourse, we have to add Osama watching over weather in cities he’s lived in using a createCapture() function,
  var capture = createCapture(VIDEO);
  capture.size(320, 240);
  var c = createCanvas(600, 600);
  // position canvas in middle of screen
  c.position(windowWidth / 2 - width / 2 + 20, windowHeight / 2 - height / 2 - 50);